Core Web Vitals have evolved from a nice-to-have performance consideration into a confirmed Google ranking factor that directly impacts your search visibility. Since their introduction as part of the Page Experience update, Google has progressively increased the weight these metrics carry in its ranking algorithm. The 2025 update replaced First Input Delay (FID) with Interaction to Next Paint (INP), raising the performance bar even higher. Data from the HTTP Archive shows that only 42% of websites pass all three Core Web Vitals thresholds, meaning the majority of the web is leaving ranking potential on the table. This guide provides the complete technical playbook for optimizing every Core Web Vital to its peak performance.
Understanding the Three Core Web Vitals Metrics
Core Web Vitals measure three dimensions of user experience: loading performance, visual stability, and interactivity. Each metric has specific thresholds that classify your page as "Good," "Needs Improvement," or "Poor." Passing all three thresholds is essential for receiving the full ranking benefit.
The Three Metrics Explained
- Largest Contentful Paint (LCP): Measures how quickly the largest visible content element loads. The threshold is 2.5 seconds or less for a "Good" rating. LCP evaluates the render time of the largest image, video, or text block visible in the viewport. It is the most intuitive metric—how fast does the page appear to be ready?
- Cumulative Layout Shift (CLS): Measures how much the page layout shifts during loading. The threshold is 0.1 or less for a "Good" rating. CLS captures the frustrating experience of trying to click a button only to have the page jump, causing a misclick. Layout shifts are scored based on their size and distance.
- Interaction to Next Paint (INP): Measures responsiveness to user interactions. The threshold is 200 milliseconds or less for a "Good" rating. INP replaced FID in March 2024 and is significantly harder to optimize because it measures all interactions throughout the page lifecycle, not just the first one.
LCP Optimization: Making Your Page Load Fast
Largest Contentful Paint is typically the most impactful metric to optimize because it addresses the most visible aspect of performance—how quickly users see meaningful content. According to Google's own research, sites that reduce LCP from 3.0 to 2.0 seconds see a 15% decrease in bounce rate and measurable improvements in conversion rates across all industries.
Server Response Time (TTFB)
Time to First Byte (TTFB) sets the floor for your LCP. No matter how well you optimize your frontend, a slow server response makes fast LCP impossible. Target a TTFB of under 200ms for optimal performance.
- Upgrade Your Hosting: Shared hosting consistently produces TTFB values above 500ms. Dedicated servers, VPS, or managed cloud hosting (AWS, Google Cloud, Vercel) can deliver sub-100ms TTFB in most regions.
- Server-Side Caching: Implement full-page caching with Redis, Varnish, or your hosting provider's built-in solution. Cached responses can reduce TTFB from 800ms to under 50ms—a transformative improvement.
- Database Optimization: Slow database queries are a common TTFB bottleneck. Add indexes to frequently queried columns, optimize complex joins, and implement query caching. A single unoptimized database query can add 500ms or more to every page load.
- CDN Implementation: Deploy a Content Delivery Network (Cloudflare, Fastly, or AWS CloudFront) to serve your pages from edge servers geographically close to your users. CDNs can reduce TTFB by 40-60% for users located far from your origin server.
Image Optimization for LCP
The LCP element is an image on approximately 72% of web pages, making image optimization the single highest-impact LCP improvement for most sites. A poorly optimized hero image can single-handedly push your LCP above 4 seconds.
- Modern Formats: Serve images in WebP or AVIF format. AVIF provides 50% better compression than JPEG and 20% better than WebP, though browser support for AVIF is still growing. Use the
<picture>element with format fallbacks. - Responsive Sizing: Use the
srcsetattribute to deliver appropriately sized images for each viewport. Serving a 2400px hero image to a 375px mobile screen wastes enormous bandwidth. - Preload the LCP Image: Add
<link rel="preload" as="image" href="hero.webp">in the document<head>to tell the browser to fetch the LCP image immediately, before it discovers it in the CSS or HTML during parsing. - Avoid Lazy Loading LCP: Never apply
loading="lazy"to the LCP image. Lazy loading delays the image request until it enters the viewport, which directly increases LCP. Only lazy load images below the fold. - Set Explicit Dimensions: Always include
widthandheightattributes on images. This allows the browser to allocate space before the image loads, preventing layout shifts and enabling faster rendering.

CLS Optimization: Eliminating Layout Shifts
Cumulative Layout Shift measures visual stability—the degree to which page elements move around during and after loading. Layout shifts are among the most frustrating user experiences on the web, and Google takes them seriously. A CLS score above 0.25 is classified as "Poor," and even scores between 0.1 and 0.25 indicate significant room for improvement.
Common CLS Culprits and Fixes
- Images Without Dimensions: When images load without explicit width and height attributes, the browser cannot reserve space for them, causing content below to shift downward. This is the number one cause of CLS issues. Solution: always include
widthandheightattributes, or use CSSaspect-ratioto reserve space. - Web Fonts (FOUT/FOIT): When custom fonts load after the initial render, text can reflow as the font changes from a fallback to the custom font. Use
font-display: optionalorfont-display: swapcombined with size-adjusted fallback fonts to minimize reflow. Preload critical fonts with<link rel="preload" as="font">. - Dynamic Content Injection: Ads, embeds, cookie consent banners, and dynamically loaded content that pushes existing content downward cause severe CLS. Reserve space for dynamic elements using CSS
min-heightbefore they load. Position banners at the top of the viewport where they push everything down uniformly. - Late-Loading CSS: CSS that loads asynchronously or is injected by JavaScript can cause the page to re-render with different styles, shifting elements. Inline critical CSS in the
<head>and defer non-critical CSS loading using themedia="print"trick orrel="preload". - Animations and Transitions: Use CSS
transformproperties (translate, scale) for animations instead of properties that trigger layout (top, left, width, height). Transform-based animations run on the GPU compositor thread and do not cause layout shifts.
INP Optimization: Making Your Site Responsive
Interaction to Next Paint is the newest Core Web Vital and the hardest to optimize. Unlike FID, which only measured the delay before the browser began processing the first interaction, INP measures the full latency from user input to the next visual update—for every interaction throughout the page session. This means slow event handlers, heavy JavaScript execution, and forced layout recalculations all contribute to a poor INP score.
JavaScript Optimization Strategies
- Code Splitting: Break your JavaScript into smaller chunks loaded on demand. A single monolithic JavaScript bundle forces the browser to parse and compile all code upfront, even code not needed for the current page. Use dynamic
import()statements and route-based splitting. - Defer Non-Critical JavaScript: Use
deferorasyncattributes on script tags for non-essential JavaScript. Analytics, chat widgets, social media embeds, and tracking scripts should never block the main thread during page load. - Break Up Long Tasks: The browser's main thread handles both JavaScript execution and user interaction processing. Any task longer than 50ms blocks the main thread and degrades INP. Use
requestAnimationFrame(),requestIdleCallback(), or the newscheduler.yield()API to break long tasks into smaller chunks. - Web Workers: Offload computationally expensive operations (data processing, complex calculations, large array manipulations) to Web Workers. Workers run on a separate thread, leaving the main thread free to handle user interactions responsively.
- Debounce and Throttle: Apply debouncing to search inputs and throttling to scroll and resize event handlers. Processing every keystroke or scroll pixel is unnecessary and creates main thread congestion that worsens INP.
Rendering Optimization
- Avoid Forced Synchronous Layouts: Reading layout properties (offsetHeight, getBoundingClientRect) after modifying the DOM forces the browser to recalculate layout synchronously. Batch DOM reads and writes separately to avoid layout thrashing.
- CSS Containment: Use CSS
contain: layout style painton independent components to tell the browser that changes inside the container do not affect the rest of the page. This allows the browser to optimize rendering by isolating repaint and reflow operations. - Virtual Scrolling: For long lists or infinite scroll interfaces, use virtual scrolling (rendering only visible items) instead of adding thousands of DOM nodes. Libraries like react-window and vue-virtual-scroller make this straightforward.
Advanced Performance Strategies
Font Loading Optimization
Custom fonts can impact all three Core Web Vitals. A comprehensive font strategy addresses LCP (font-based LCP elements), CLS (text reflow when fonts load), and INP (font parsing can block the main thread on slower devices).
- Subset Fonts: If your site only uses Latin characters, subset your fonts to remove unused character ranges. A full Google Fonts file might be 150KB, while a Latin-only subset is often 15-20KB—a 90% reduction.
- Self-Host Fonts: Hosting fonts on your own domain (or CDN) eliminates the DNS lookup and connection overhead of fetching from a third-party like Google Fonts. The performance difference is typically 100-300ms on the font loading timeline.
- Preconnect and Preload: If using external font services, add
<link rel="preconnect" href="https://fonts.googleapis.com">to establish the connection early. For the most critical font file, use<link rel="preload" as="font">to fetch it immediately.
Caching and Resource Hints
Effective caching strategies dramatically improve repeat-visit performance and reduce server load. Combined with resource hints, they create a performance-optimized experience from the first byte to the last interaction.
- Cache-Control Headers: Set
Cache-Control: max-age=31536000, immutablefor versioned static assets (CSS, JS, images with hash filenames). Usemax-age=3600, must-revalidatefor HTML documents that change frequently. - Service Workers: Implement a service worker for offline caching and instant repeat-visit loading. A well-configured service worker can serve cached pages in under 100ms, virtually eliminating LCP on return visits.
- Prefetch and Prerender: Use
<link rel="prefetch">for likely next-page resources and the new Speculation Rules API for instant page transitions. Chrome's prerender can make navigations appear instantaneous.
"Performance is not a one-time optimization project. It is a continuous discipline. The teams that consistently pass Core Web Vitals are the ones that integrate performance budgets into their development process, test every deployment, and treat regression as a bug, not a trade-off."
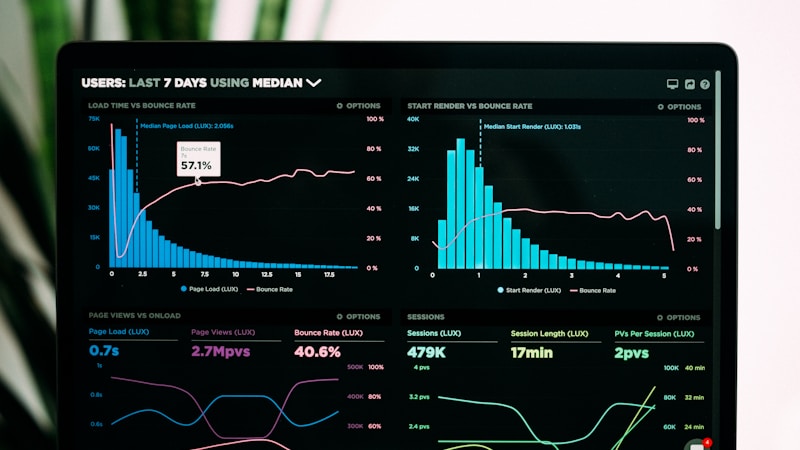
Measuring and Monitoring Your Progress
Optimization without measurement is guesswork. Establish a monitoring stack that combines lab testing (controlled, reproducible measurements) with field data (real-user measurements from actual visitors). The gap between lab and field results often reveals issues that synthetic testing misses—slow devices, poor network conditions, and geographic latency all affect real users.
- Google Search Console: The Core Web Vitals report groups your pages by status (Good, Needs Improvement, Poor) and shows trends over time. This is Google's own data source for ranking decisions.
- PageSpeed Insights: Combines Lighthouse lab data with CrUX field data for a comprehensive page-level assessment. Run this after every significant deployment.
- Chrome User Experience Report (CrUX): The public dataset of real-user performance data. Access it through BigQuery for large-scale competitive analysis.
- Web Vitals JavaScript Library: Integrate Google's
web-vitalslibrary into your analytics to track Core Web Vitals for every page view, segmented by device, geography, and connection type.
Core Web Vitals optimization is a competitive advantage that compounds over time. As you improve your scores, you earn higher rankings, which drives more traffic, which generates more revenue, which justifies further performance investment. Start with the highest-impact optimizations—typically LCP image handling and CLS dimension fixes—then progressively tackle INP and advanced strategies. Combine performance excellence with strong content optimization and holistic SEO, and you will build a website that outperforms competitors on every dimension that matters.
Optimize Your Core Web Vitals with Precision
Our performance monitoring dashboard tracks all three Core Web Vitals across your entire site, identifies pages failing thresholds, and provides prioritized fix recommendations with estimated ranking impact. Start your free performance audit today.